Example for autoplot
Example for quickly displaying and saving a 2D map of data
There are various options available for autoplot. This only returns the figure, not the data itself.
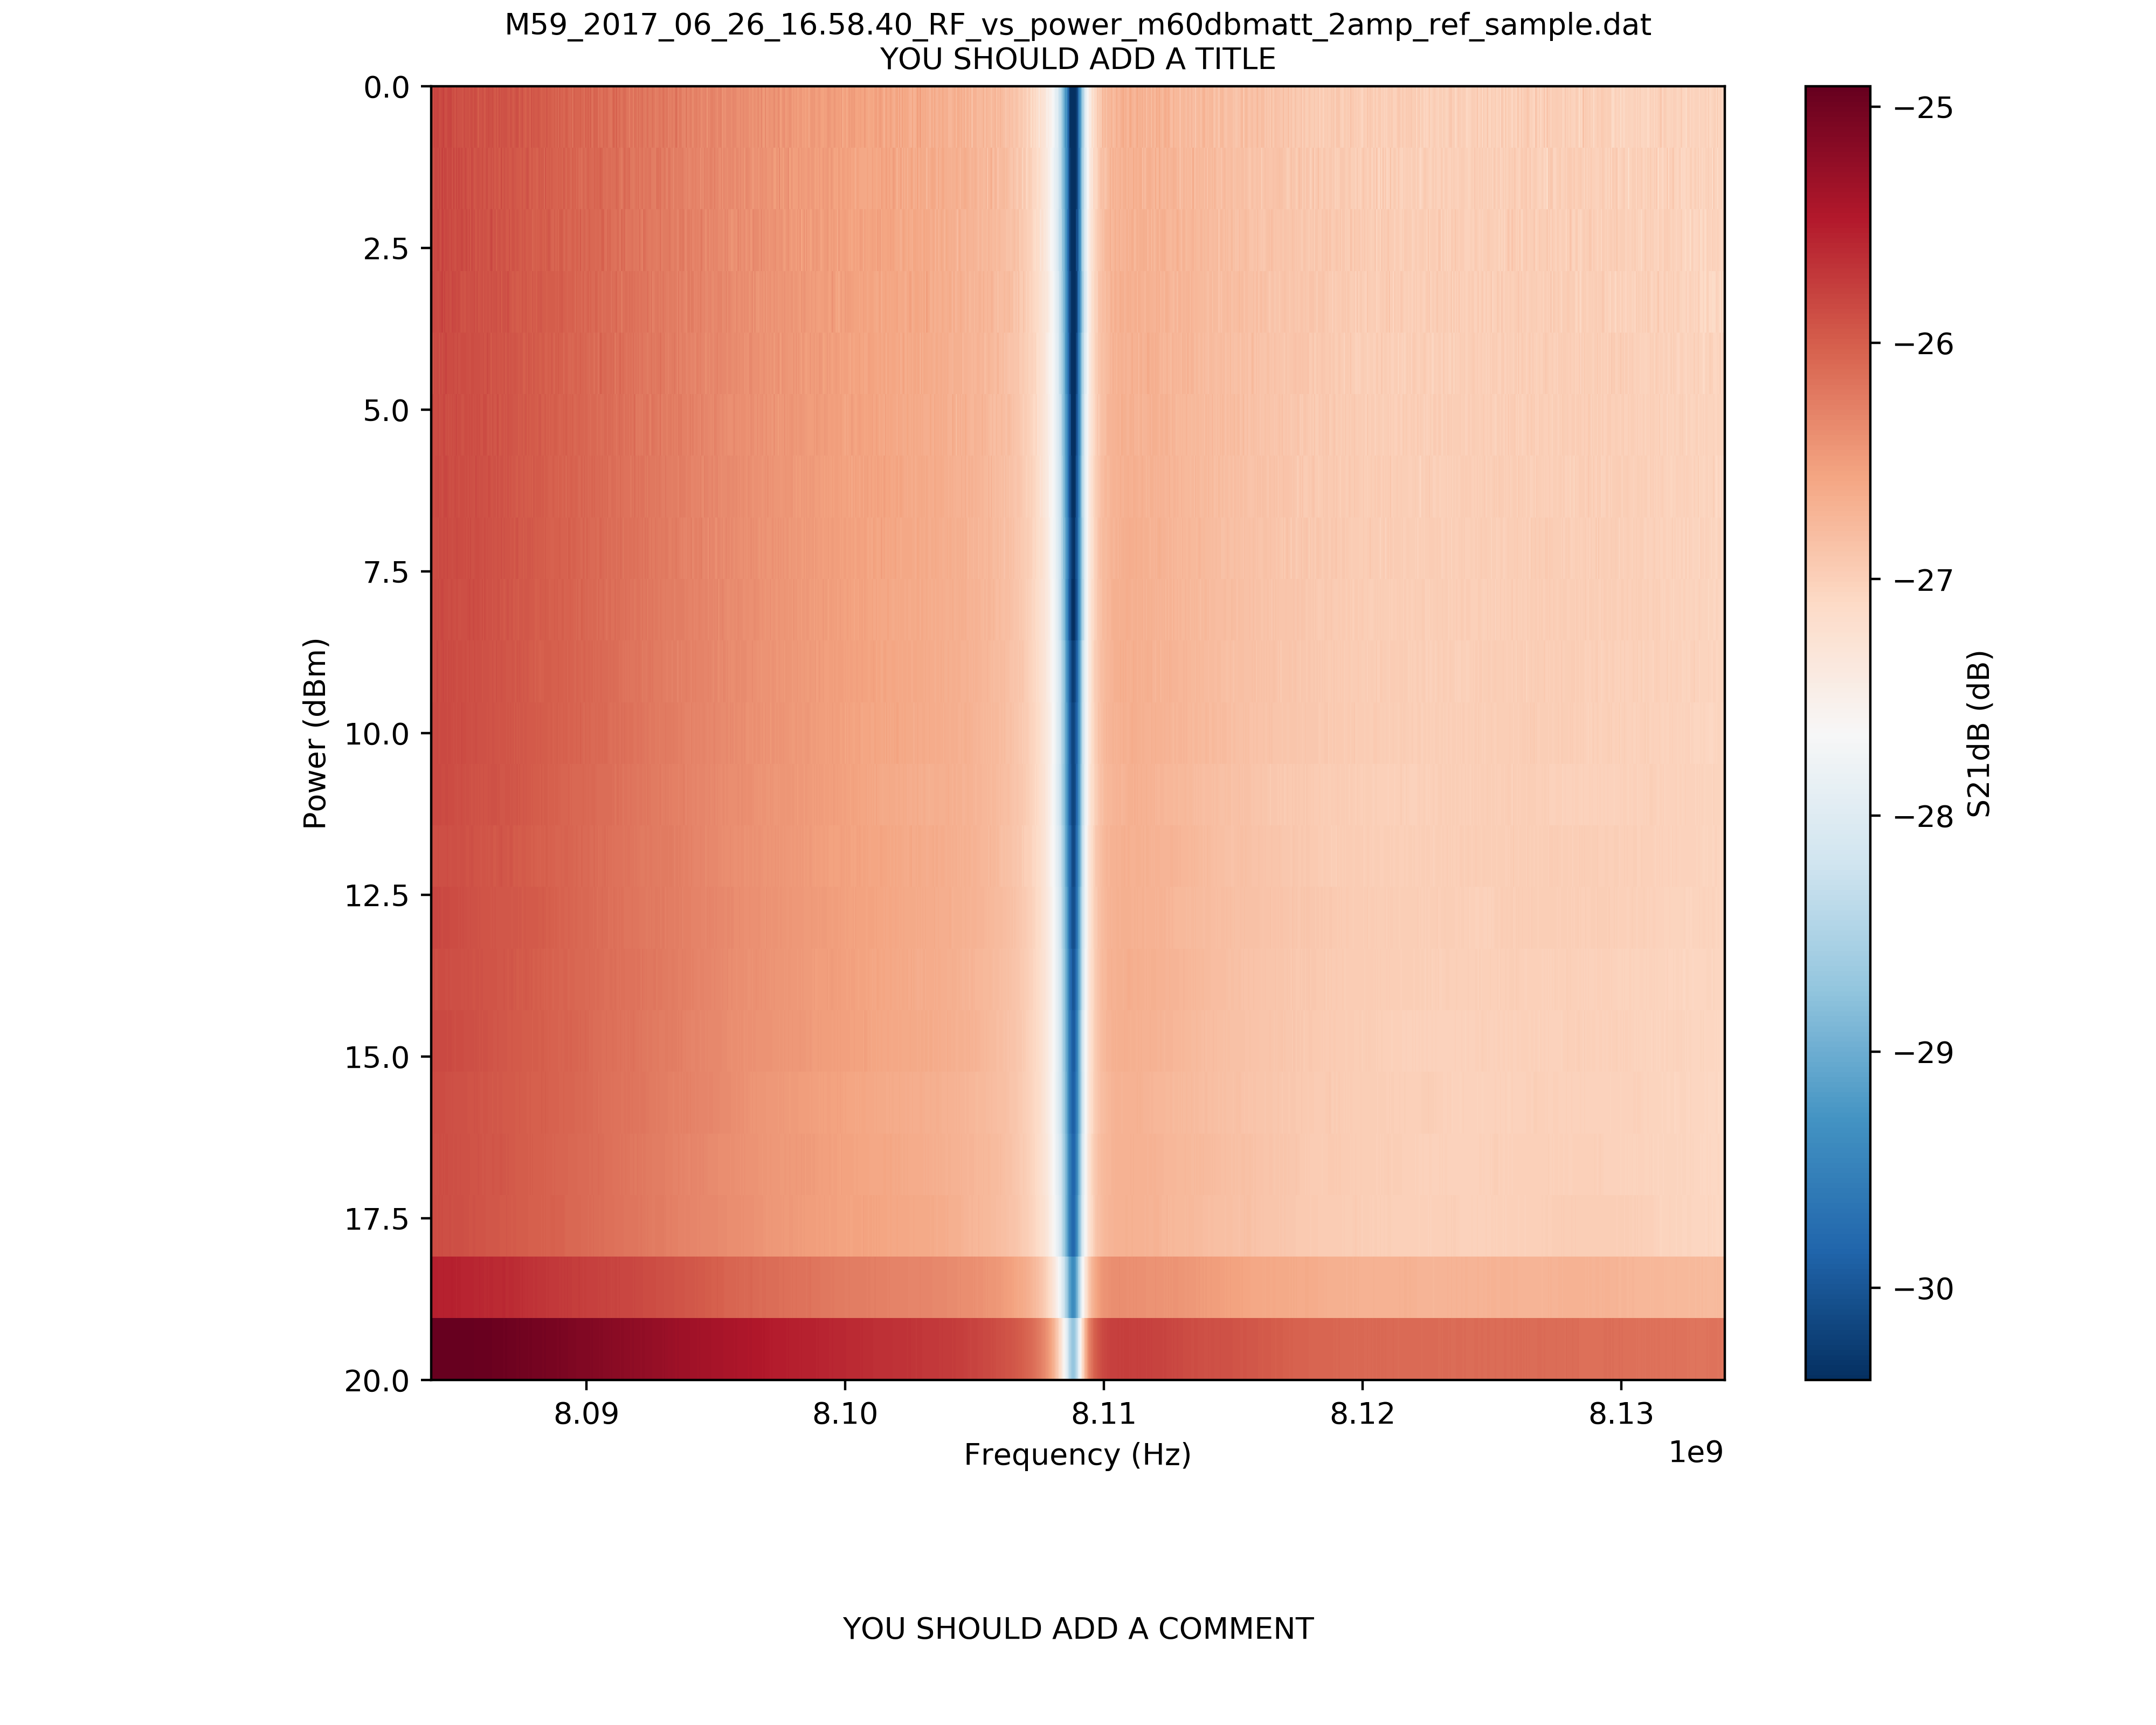
2D map of M59_2017_06_26_16.58.40_RF_vs_power_m60dbmatt_2amp_ref_sample.dat.
"""Example for quickly displaying and saving a 2D map of data

There are various options available for autoplot. This only returns the figure, not the data itself.

"""

import stlabutils

# Import data
myfilename = './data/M59_2017_06_26_16.58.40_RF_vs_power_m60dbmatt_2amp_ref_sample.dat'

# Plot data
stlabutils.autoplot(
    myfilename,
    xlab='Frequency (Hz)',
    ylab='Power (dBm)',
    zlab='S21dB (dB)',
    show=True,
    save=True)